Welcome to
Data Driven Tales
Where Numbers Meet Narratives
March 20, 2005

Every dataset has a story waiting to be uncovered, and that’s the heart of Data Driven Tales. This blog is a journey into the world of data analytics—a space where raw numbers are transformed into actionable insights, and technical tools become the paintbrushes for crafting meaningful narratives. Here, I’ll share my personal evolution from a high school math teacher and volleyball coach to a budding data analyst, all while embracing the art and science of storytelling through data.
For 28 years, I honed my skills as a math teacher, fostering problem-solving and precision in the classroom while coaching teamwork and strategy on the volleyball court. My passion for collaboration and innovation led me to earn a Master’s degree in Instructional Technology, where I began exploring ways to bring technology into learning. Now, I’m channeling that same drive for growth and learning into the field of data analytics—mastering tools like Excel, SQL, and Tableau, while unraveling the hidden stories within numbers.
In Data Driven Tales, you’ll find more than just technical tips and tutorials. Together, we’ll explore how to bridge the gap between data and decision-making, crafting visualizations and insights that resonate with any audience. I’ll draw inspiration from excellent resources like Storytelling with Data, Luke Barousse, Alex The Analyst, and Coursera, sharing what I learn along the way. Whether you’re a fellow data enthusiast, a professional looking to grow your skills, or simply someone curious about the magic of analytics, this blog is for you.
Join me on this exciting adventure as I decode trends, share tips, and uncover the stories that data has to tell. Together, we’ll discover how the right tools, a touch of creativity, and a passion for storytelling can turn numbers into narratives that inspire and inform. Welcome to Data Driven Tales let’s make data come alive!
Explore the Landscape of Data Analytics Careers
March 20, 2025 – Insights from January 2023
The field of data analytics is vast, encompassing a variety of job titles and specialized roles. A recent chart analyzing job opportunities in the U.S. as of January 2023 reveals fascinating trends in the distribution of roles within the industry. From the data, it’s clear that positions like Data Analyst and Data Scientist lead the way, with 982 and 869 jobs listed, respectively, showcasing their dominance in the analytics field. On the other end of the spectrum, niche roles such as Cloud Engineer and Software Engineer appear far less frequently, with only 4 and 34 jobs, respectively.
This chart provides valuable insights for those navigating or planning their career in data analytics. For example, the high demand for Data Analysts and Data Scientists suggests these roles are excellent starting points for those entering the field or professionals looking to pivot into analytics. Meanwhile, the limited number of listings for specialized roles like Cloud Engineers highlights potential niches for individuals with a keen interest in technical or hybrid fields within analytics. Understanding this landscape can guide aspiring data professionals in targeting roles that align with their skills, interests, and career aspirations.
As someone diving into the world of data analytics, I find this breakdown particularly enlightening. It underscores the importance of mastering versatile tools like Excel, SQL, and Tableau while staying curious and adaptable to emerging trends. Whether you’re exploring a new career or furthering your analytics expertise, this data-driven snapshot serves as a reminder that every role contributes to the broader story of turning information into impactful insights. Let’s use this knowledge to chart a path toward impactful and fulfilling careers in analytics!

April 1, 2025
Unearthing Insights:
Exploring Women’s Basketball Data from the NCAA
When it comes to analyzing basketball metrics, data is your best teammate. For the 2023-2024 NCAA Women’s Basketball season, I embarked on an adventure to obtain, clean, and explore data to uncover trends, insights, and narratives worth sharing. Here’s how the journey unfolded:
Getting the Data from the NCAA Website
The NCAA website serves as a treasure trove for basketball enthusiasts, offering detailed statistics for teams and players throughout the season. Finding the data for the 2023-2024 Women’s Basketball season required some strategic navigation:
- Locate Team Statistics: On the NCAA Women’s Basketball section, I identified team stats such as points per game, field goal percentage, assists, turnovers, and rebounds.
- Download the Data: Many tables offered the option to export data as CSV files. These downloadable files provided the foundation for analysis.
Cleaning the Data in Excel
Once the data was collected, the work truly began. Raw datasets often come with quirks like missing values, inconsistent formats, or unnecessary columns. Here’s how I cleaned the NCAA Women’s Basketball data:
- Standardizing Column Names: I ensured every column had consistent and meaningful titles, such as “Team Name,” “Points Per Game,” or “Turnover Percentage.”
- Removing Unnecessary Columns: Metrics not relevant to my analysis were filtered out, leaving behind only the essentials.
- Sorting and Filtering: I used Excel’s sorting feature to rank teams by metrics such as assist-to-turnover ratio or field goal percentage, making comparisons straightforward.
What’s Next?
This journey into NCAA Women’s Basketball data has been equal parts challenging and rewarding. Armed with structured data and Excel expertise, the possibilities are endless—predictive modeling for championship outcomes, creating visual dashboards, or sharing insights on GitHub for others to learn from.
For fellow data enthusiasts, I encourage you to dive into the world of basketball stats. Whether you’re a sports analyst, Python programmer, or Excel fanatic, the game isn’t just played on the court; it’s brought to life in the numbers. What trends will you uncover?
Who will WIN?
Can we predict the winner?

The Impact of Winning Percentages in Women's Basketball
April 5, 2025
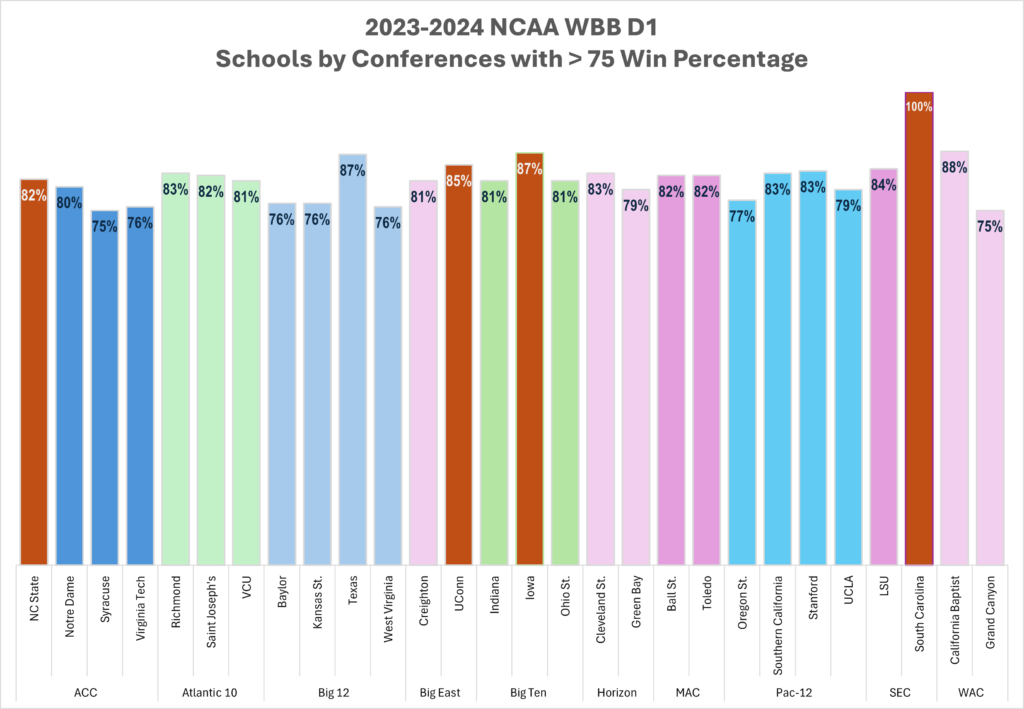
When evaluating basketball teams, one of the most defining metrics is win percentage. This statistic not only highlights a team’s success but also reflects consistency, strategy, and determination over a season. In this post, we’ll explore teams with an impressive win percentage of over 70% and what these numbers tell us about their performance in the 2023–2024 season.
Visualizing Excellence
The graph below captures the teams that achieved win percentages above 70% during this season. By filtering the data, these elite teams stand out as benchmarks of success in collegiate women’s basketball.
Key points to note:
- Dominance Across Conferences: Teams like South Carolina and UConn have consistently demonstrated excellence, achieving win percentages that place them at the top of their respective conferences.
- Season Performance and Strength: These high percentages underline not just talent but also cohesion among players, smart coaching, and the ability to adapt to competitive challenges.
Behind the Numbers
Win percentage reflects several critical factors:
- Team Chemistry: Teams that gel well together on and off the court often outperform others. This synergy is evident in stats like assists and turnover ratios.
- Strong Defense: Teams with high win percentages tend to have solid defensive metrics—restricting opponent field goal percentages and turnovers play a crucial role.
- Effective Scoring: Consistency in shooting, free-throws, and bench contributions helps secure victories game after game.
Spotlight on the Final Four Teams
The 2024 NCAA Women’s Basketball Tournament showcased four exceptional teams in the Final Four:
- South Carolina: The undefeated No. 1 seed Gamecocks made their fourth consecutive Final Four appearance, continuing their quest for dominance in collegiate basketball.
- Iowa: Led by the phenomenal Caitlin Clark, Iowa advanced to the semifinals for the second straight year, showcasing their offensive prowess and determination.
- NC State: The Wolfpack reached their first Final Four since 1998, defeating No. 1 Texas in a thrilling regional final.
- UConn: A perennial powerhouse, UConn returned to the Final Four, demonstrating their resilience and championship pedigree.
These teams exemplified the qualities that define greatness in basketball—teamwork, strategy, and the ability to perform under pressure.
A Lesson for Aspiring Teams
The journey to achieving success in basketball goes far beyond talent—it requires a cohesive strategy, relentless determination, and a willingness to learn from the best. For teams aspiring to surpass the 70% win percentage mark or reach the prestigious Final Four, studying elite performers offers invaluable lessons.
- The Importance of Strong Fundamentals
Elite teams emphasize core basketball skills, such as precision shooting, effective passing, and disciplined defense. Players are not just skilled in isolation; they excel at integrating these fundamentals into fluid gameplay that maximizes their collective potential. - Leverage Team Chemistry
Teams like South Carolina and Iowa demonstrate how critical it is for players to understand each other’s strengths and weaknesses. Cohesion on the court translates to better ball movement, timely assists, and fewer turnovers. Aspiring teams can build chemistry through off-court bonding, rigorous training, and clear communication. - Adaptability in High-Pressure Situations
Games are often won by the ability to adapt to opponents’ strategies and respond to high-pressure situations. Elite teams thrive under pressure, demonstrating resilience and creativity when faced with tough opponents. Aspiring teams must develop the mental toughness to stay focused and confident during crucial moments. - Strategic Coaching
Great coaches like Dawn Staley and Geno Auriemma are known for their tactical acumen and ability to inspire their players. Coaches play a pivotal role in analyzing opponents, developing game plans, and fostering a positive team culture. Aspiring teams should prioritize strong leadership to navigate challenges effectively. - Data-Driven Insights
Advanced analytics provide a competitive edge. By studying metrics such as win percentages, assist-to-turnover ratios, and field goal efficiencies, teams can pinpoint areas for improvement and craft personalized strategies to enhance performance. Aspiring teams should embrace technology and data analysis as integral parts of their growth. - Continuous Improvement
Success requires constant evaluation and iteration. Aspiring teams should review game footage, analyze past performances, and set achievable goals for improvement. Learning from mistakes and celebrating small victories along the way create a foundation for sustained excellence.
Aspiring teams are not just chasing numbers; they are chasing growth, ambition, and the ultimate dream of championship glory. With the right mindset, preparation, and focus, the lessons from the top teams can inspire greatness for seasons to come.
Closing Thoughts
Women’s basketball is a celebration of talent, grit, and strategy. The teams with win percentages over 70% and the Final Four participants remind us of the power of dedication and teamwork. These athletes inspire not only through their victories but also through their resilience and determination to excel at the highest level.
The 2024 NCAA Women’s Basketball Tournament culminated in an unforgettable championship game between the South Carolina Gamecocks and the Iowa Hawkeyes. South Carolina, led by their exceptional coach Dawn Staley, showcased their dominance throughout the season and capped it off with a stellar performance in the final. They defeated Iowa 87–75 to claim their third national championship in program history. Iowa, despite falling short, demonstrated incredible skill and determination, with Caitlin Clark delivering standout performances throughout the tournament.
As we look ahead, the lessons from these teams—both their triumphs and challenges—serve as a source of inspiration for players, coaches, and fans alike. Whether you’re analyzing data, strategizing for the next season, or simply cheering from the stands, there’s always something to learn from the game.
Here are a few thought-provoking questions when reviewing the graph:
- Performance Analysis:
- What trends or patterns do you notice among teams with a win percentage over 70%?
- Are there certain conferences that dominate in terms of high win percentages?
- Conference Comparisons:
- How do the top-performing conferences compare to each other in terms of total wins and consistency?
- Do smaller or less-known conferences have any standout teams in this category?
- Impactful Metrics:
- Beyond win percentage, what other metrics from the graph, like field goal percentage or assist-turnover ratio, correlate strongly with success?
- Historical Context:
- How does this season’s data align with previous seasons? Are there emerging trends or shifts in team performance?
- Final Four Teams Connection:
- How do the win percentages of last year’s Final Four teams compare to those on your graph? Did their stats set them apart early on?
Spotlight on the Final Four Teams
The 2025 NCAA Women’s Basketball Tournament has brought together four incredible teams in the Final Four, each showcasing exceptional talent and determination:
- South Carolina (100% win rate): The undefeated Gamecocks, led by their experienced coach Dawn Staley, continue to dominate the basketball landscape. Known for their stifling defense and cohesive gameplay, South Carolina defeated Texas in the semifinals with a convincing score of 74–57, solidifying their place in the championship game.
- UConn (84.6% win rate): A perennial powerhouse, the Huskies once again proved their resilience under the leadership of Geno Auriemma. With Paige Bueckers delivering a standout performance, UConn triumphed over UCLA in the semifinals with an impressive 85–51 win, earning a chance to claim the title.
- Texas (86.8% win rate): The Longhorns have showcased remarkable defense throughout the tournament, holding opponents to under 62 points per game. Despite their semifinal loss to South Carolina, their disciplined approach and strategic plays made them a standout contender this season.
- UCLA (79.4% win rate): The Bruins have been one of the season’s most inspiring stories. Led by Lauren Betts, they demonstrated their defensive strength and adaptability, making a strong push to the Final Four before falling to UConn in the semifinals.
These teams exemplify the qualities that define greatness in collegiate basketball—teamwork, strategy, and the ability to perform under pressure. The championship matchup between South Carolina and UConn promises to be an electrifying finale to an incredible season.
My Pick – UConn(I’d just love to see Paige Bueckers get a National Title, but I think the Gamecocks will be tough to beat)
"Tracking Demand:
Quarterly Job Postings for 'Data' Roles in 2023"
April 7, 2025
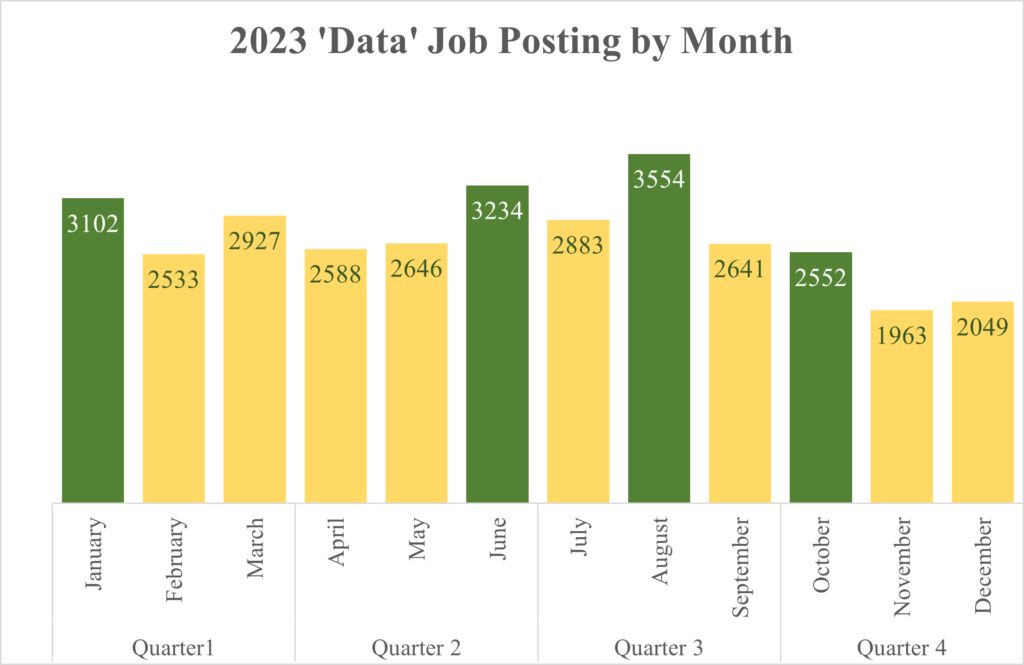
The demand for data-related roles has been unwavering in 2023, showing distinct peaks throughout the year. By analyzing job postings by month and quarter for positions with “Data” in the title, we gain valuable insight into hiring cycles and industry trends.
Quarterly Highlights
Analyzing the data reveals key moments of heightened hiring activity:
- Q1 (January): Starting the year strong, January saw 3,102 job postings, as companies kicked off hiring aligned with new annual strategies and projects.
- Q2 (June): Mid-year hiring peaked with 3,234 postings, reflecting companies ramping up resources to meet project goals and prepare for the second half of the year.
- Q3 (August): The highest monthly postings occurred in August with 3,554 jobs, signaling pre-fall recruitment efforts as organizations set their sights on end-of-year deliverables.
- Q4 (October): Wrapping up the year, October had 2,552 postings, demonstrating consistent demand even as companies finalized their 2023 staffing needs.
Visualizing the Trends
Using Excel, I structured and analyzed the data to bring clarity to the monthly and quarterly variations. The chart effectively illustrates the peaks and dips, making these insights accessible for professionals looking to align their job search strategies with hiring patterns.
Key Takeaways for Data Professionals
- Timing is crucial: Focusing job search efforts during peak months like August and January can significantly improve opportunities.
- Skills matter: With roles in data analysis, engineering, and science driving demand, professionals should focus on strengthening their expertise in tools like Excel, SQL, and Power BI to stay competitive.
Preparing for 2024
Understanding hiring cycles is just the first step. As data-driven roles evolve, adapting to industry needs and staying informed about trends ensures long-term success. Whether it’s analyzing job postings or preparing for interviews, staying proactive is key.
Follow-Up Question:
Given the cyclical nature of job postings, what strategies can professionals adopt to stand out in peak months while maintaining momentum during quieter periods?